Rufous Whistler
Pachycephala rufiventris
ABR description
The following is extracted from the Annual Bird Report for the twelve months to June 2017.
Common, breeding summer migrant
A summer migrant found mostly in open woodlands.
General: 2,533 birds recorded, similar to last year (2,456) though many more than the 10YA (1,284) and the 30YA (778). Recorded in every month, with a far higher proportion of records in spring (48%) and summer (39%) than in autumn (11%) and winter (1%). Reporting rate is at its lowest level since systematic recording began, (8.4%) similar to that of last year (9.7%) but lower than the 10YA (13.8%) and the 30YA (16.7%). Recorded from 56% of grid cells surveyed (54% last year), close to the 10YA (54%) and the 30YA (49%). Max 20 (21 last year), mean 2.2, median 1. Abundance (0.1790) similar to last year (0.2099) though lower than the 10YA (0.2706) and the 30YA (0.2855). 23 breeding records (14 last year) from nb/11 Nov JWNR (WyP1) to dy/19 Mar Whiskers Creek Rd, Carwoola GrQ16 (BuM1).
GBS: 105 birds recorded, similar to last year (133) though fewer than the 10YA (170) and the 30YA (199). 76 records compared with 91 last year, fewer than the 10YA (122) and the 30YA (158). Recorded in every month except for May, Jun and Aug, with a much higher proportion of records in spring (42%) and summer (45%) than in autumn (12%) and winter (1%). The apparent contraction in the length of stay commented upon last year has continued, albeit to a lesser extent than in 2014-15 and 2015-16. Records from 15% of sites, similar to last year (18%) though lower than the 10YA (26%) and the 30YA (41%). Abundance similar to last year.
Abundance
Abundance is the average number of birds of that species per survey. Where the species was observed (presence recorded) but the number of birds seen was not recorded, this is treated as a count of zero.
Abundance by year
This chart shows the abundance of Rufous Whistler between 1982 and 2017. 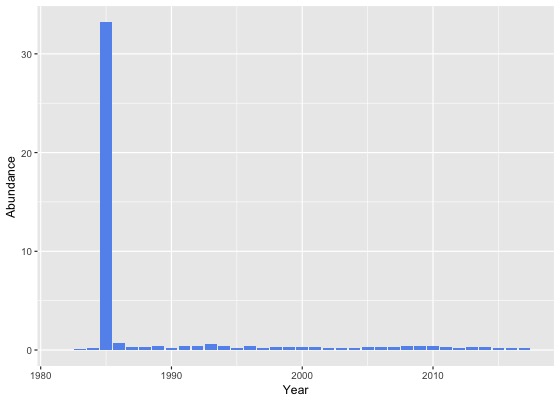
Abundance by month
This chart shows the monthly abundance of Rufous Whistler. The blue lines show the abundance for the twelve months to June 2017 and the bars show the average abundance for the period 1982 to 2017. 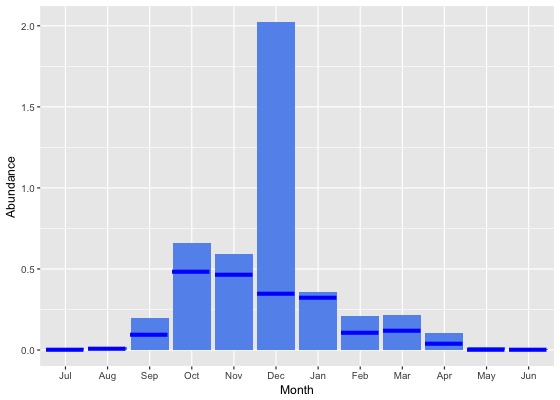
Abundance by season
This chart shows the seasonal abundance of Rufous Whistler. The blue lines show the seasonal abundance for the twelve months to June 2017 and the bars show the average seasonal abundance for the period 1982 to 2017. 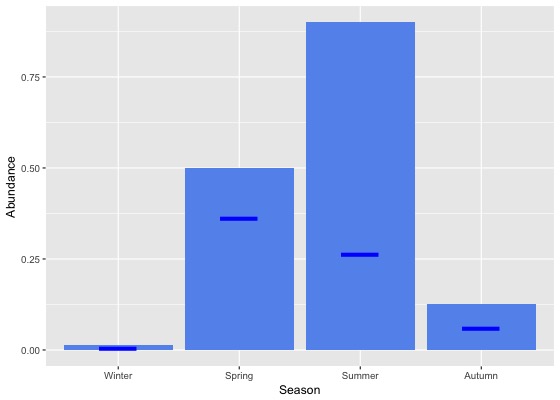
Abundance data
| Month | Season | ||||||||||||||||||
|---|---|---|---|---|---|---|---|---|---|---|---|---|---|---|---|---|---|---|---|
| Period | Jul | Aug | Sep | Oct | Nov | Dec | Jan | Feb | Mar | Apr | May | Jun | Winter | Spring | Summer | Autumn | All | ||
| All years | |||||||||||||||||||
| All | 0.0 | 0.0 | 0.2 | 0.7 | 0.6 | 2.0 | 0.4 | 0.2 | 0.2 | 0.1 | 0.0 | 0.0 | 0.0 | 0.5 | 0.9 | 0.1 | 0.4 | ||
| Previous years | |||||||||||||||||||
| All previous years | 0.0 | 0.0 | 0.2 | 0.7 | 0.6 | 2.3 | 0.4 | 0.2 | 0.2 | 0.1 | 0.0 | 0.0 | 0.0 | 0.5 | 1.0 | 0.1 | 0.4 | ||
| Previous 30 years | 0.0 | 0.0 | 0.2 | 0.7 | 0.6 | 0.5 | 0.4 | 0.2 | 0.2 | 0.1 | 0.0 | 0.0 | 0.0 | 0.5 | 0.4 | 0.1 | 0.3 | ||
| Previous 20 years | 0.0 | 0.0 | 0.2 | 0.7 | 0.6 | 0.5 | 0.3 | 0.2 | 0.2 | 0.1 | 0.0 | 0.0 | 0.0 | 0.5 | 0.3 | 0.1 | 0.3 | ||
| 10 year groups | |||||||||||||||||||
| [2007,2017) | 0.0 | 0.0 | 0.2 | 0.7 | 0.5 | 0.4 | 0.3 | 0.2 | 0.2 | 0.1 | 0.0 | 0.0 | 0.0 | 0.5 | 0.3 | 0.1 | 0.3 | ||
| [1997,2007) | 0.0 | 0.0 | 0.2 | 0.6 | 0.7 | 0.6 | 0.4 | 0.2 | 0.2 | 0.1 | 0.0 | 0.0 | 0.0 | 0.5 | 0.4 | 0.1 | 0.3 | ||
| [1987,1997) | 0.0 | 0.1 | 0.2 | 0.6 | 0.7 | 0.7 | 0.5 | 0.3 | 0.4 | 0.2 | 0.1 | 0.0 | 0.0 | 0.6 | 0.5 | 0.2 | 0.3 | ||
| 5 year groups | |||||||||||||||||||
| [2012,2017) | 0.0 | 0.0 | 0.2 | 0.7 | 0.4 | 0.4 | 0.3 | 0.2 | 0.2 | 0.1 | 0.0 | 0.0 | 0.0 | 0.5 | 0.3 | 0.1 | 0.2 | ||
| [2007,2012) | 0.0 | 0.0 | 0.3 | 0.8 | 0.7 | 0.5 | 0.4 | 0.3 | 0.2 | 0.1 | 0.0 | 0.0 | 0.0 | 0.6 | 0.4 | 0.1 | 0.3 | ||
| [2002,2007) | 0.0 | 0.0 | 0.2 | 0.5 | 0.6 | 0.5 | 0.3 | 0.2 | 0.2 | 0.1 | 0.0 | 0.0 | 0.0 | 0.5 | 0.4 | 0.1 | 0.3 | ||
| [1997,2002) | 0.0 | 0.0 | 0.2 | 0.7 | 0.7 | 0.6 | 0.5 | 0.3 | 0.2 | 0.1 | 0.0 | 0.0 | 0.0 | 0.5 | 0.5 | 0.1 | 0.3 | ||
| [1992,1997) | 0.0 | 0.0 | 0.2 | 0.8 | 1.1 | 0.8 | 0.6 | 0.3 | 0.4 | 0.1 | 0.1 | 0.0 | 0.0 | 0.7 | 0.6 | 0.2 | 0.4 | ||
| [1987,1992) | 0.0 | 0.1 | 0.2 | 0.6 | 0.6 | 0.6 | 0.5 | 0.4 | 0.4 | 0.2 | 0.1 | 0.0 | 0.0 | 0.5 | 0.5 | 0.2 | 0.3 | ||
| Year | |||||||||||||||||||
| 2017 | 0.0 | 0.0 | 0.1 | 0.5 | 0.5 | 0.4 | 0.3 | 0.1 | 0.1 | 0.0 | 0.0 | 0.0 | 0.0 | 0.4 | 0.3 | 0.1 | 0.2 | ||
| 2016 | 0.0 | 0.0 | 0.2 | 0.7 | 0.4 | 0.3 | 0.3 | 0.1 | 0.2 | 0.1 | 0.0 | 0.0 | 0.0 | 0.5 | 0.2 | 0.1 | 0.2 | ||
| 2015 | 0.0 | 0.0 | 0.2 | 0.7 | 0.5 | 0.4 | 0.3 | 0.2 | 0.2 | 0.1 | 0.0 | 0.0 | 0.0 | 0.5 | 0.3 | 0.1 | 0.2 | ||
| 2014 | 0.0 | 0.0 | 0.2 | 0.8 | 0.4 | 0.6 | 0.3 | 0.3 | 0.2 | 0.1 | 0.0 | 0.0 | 0.0 | 0.6 | 0.4 | 0.1 | 0.3 | ||
| 2013 | 0.0 | 0.0 | 0.2 | 0.7 | 0.5 | 0.4 | 0.3 | 0.2 | 0.1 | 0.1 | 0.0 | 0.0 | 0.0 | 0.5 | 0.3 | 0.1 | 0.3 | ||
| 2012 | 0.0 | 0.0 | 0.1 | 0.5 | 0.3 | 0.3 | 0.2 | 0.2 | 0.3 | 0.1 | 0.0 | 0.0 | 0.0 | 0.4 | 0.2 | 0.1 | 0.2 | ||
| 2011 | 0.0 | 0.0 | 0.2 | 0.7 | 0.8 | 0.4 | 0.3 | 0.2 | 0.2 | 0.2 | 0.0 | 0.0 | 0.0 | 0.6 | 0.3 | 0.1 | 0.3 | ||
| 2010 | 0.0 | 0.0 | 0.3 | 0.7 | 0.8 | 0.5 | 0.4 | 0.3 | 0.3 | 0.1 | 0.0 | 0.0 | 0.0 | 0.6 | 0.4 | 0.2 | 0.4 | ||
| 2009 | 0.0 | 0.0 | 0.3 | 0.9 | 0.7 | 0.5 | 0.5 | 0.3 | 0.1 | 0.1 | 0.0 | 0.0 | 0.0 | 0.7 | 0.4 | 0.1 | 0.4 | ||
| 2008 | 0.0 | 0.0 | 0.3 | 0.8 | 0.7 | 0.6 | 0.7 | 0.3 | 0.2 | 0.2 | 0.0 | 0.0 | 0.0 | 0.6 | 0.6 | 0.2 | 0.4 | ||
| 2007 | 0.0 | 0.0 | 0.2 | 0.8 | 0.5 | 0.6 | 0.3 | 0.4 | 0.2 | 0.1 | 0.0 | 0.0 | 0.0 | 0.6 | 0.4 | 0.1 | 0.3 | ||
| 2006 | 0.0 | 0.0 | 0.2 | 0.9 | 0.7 | 0.5 | 0.5 | 0.3 | 0.3 | 0.1 | 0.0 | 0.0 | 0.0 | 0.7 | 0.4 | 0.2 | 0.3 | ||
| 2005 | 0.0 | 0.0 | 0.2 | 0.4 | 0.7 | 0.8 | 0.6 | 0.4 | 0.1 | 0.1 | 0.0 | 0.0 | 0.0 | 0.4 | 0.6 | 0.1 | 0.3 | ||
| 2004 | 0.0 | 0.0 | 0.3 | 0.3 | 0.6 | 0.4 | 0.3 | 0.4 | 0.2 | 0.1 | 0.0 | 0.0 | 0.0 | 0.4 | 0.4 | 0.1 | 0.2 | ||
| 2003 | 0.0 | 0.0 | 0.2 | 0.3 | 0.7 | 0.5 | 0.2 | 0.1 | 0.2 | 0.1 | 0.0 | 0.0 | 0.0 | 0.4 | 0.3 | 0.1 | 0.2 | ||
| 2002 | 0.0 | 0.0 | 0.2 | 0.3 | 0.5 | 0.5 | 0.2 | 0.2 | 0.3 | 0.1 | 0.0 | 0.0 | 0.0 | 0.4 | 0.4 | 0.2 | 0.2 | ||
| 2001 | 0.0 | 0.0 | 0.3 | 0.8 | 0.5 | 0.7 | 0.3 | 0.4 | 0.2 | 0.1 | 0.0 | 0.0 | 0.0 | 0.5 | 0.5 | 0.1 | 0.3 | ||
| 2000 | 0.0 | 0.0 | 0.2 | 0.6 | 0.8 | 0.4 | 0.4 | 0.2 | 0.2 | 0.1 | 0.0 | 0.0 | 0.0 | 0.5 | 0.4 | 0.1 | 0.3 | ||
| 1999 | 0.0 | 0.0 | 0.3 | 0.7 | 0.9 | 0.9 | 0.7 | 0.2 | 0.3 | 0.1 | 0.0 | 0.0 | 0.0 | 0.6 | 0.6 | 0.1 | 0.4 | ||
| 1998 | 0.0 | 0.0 | 0.2 | 0.4 | 0.6 | 0.6 | 0.7 | 0.1 | 0.1 | 0.1 | 0.0 | 0.0 | 0.0 | 0.4 | 0.5 | 0.1 | 0.3 | ||
| 1997 | 0.0 | 0.0 | 0.2 | 0.5 | 0.6 | 0.3 | 0.6 | 0.1 | 0.3 | 0.1 | 0.0 | 0.0 | 0.0 | 0.4 | 0.3 | 0.1 | 0.2 | ||
| 1996 | 0.0 | 0.0 | 0.5 | 0.8 | 0.7 | 0.8 | 0.6 | 0.1 | 0.2 | 0.0 | 0.4 | 0.0 | 0.0 | 0.7 | 0.5 | 0.2 | 0.4 | ||
| 1995 | 0.0 | 0.0 | 0.0 | 0.3 | 0.6 | 0.4 | 0.7 | 0.3 | 0.4 | 0.1 | 0.0 | 0.0 | 0.0 | 0.3 | 0.5 | 0.2 | 0.2 | ||
| 1994 | 0.0 | 0.0 | 0.2 | 1.2 | 0.9 | 1.4 | 0.6 | 0.3 | 0.3 | 0.1 | 0.0 | 0.0 | 0.0 | 0.8 | 0.7 | 0.1 | 0.4 | ||
| 1993 | 0.0 | 0.0 | 0.0 | 1.0 | 2.6 | 1.5 | 0.8 | 0.3 | 0.5 | 0.2 | 0.1 | 0.0 | 0.0 | 1.2 | 0.9 | 0.3 | 0.6 | ||
| 1992 | 0.0 | 0.0 | 0.1 | 1.0 | 1.4 | 0.6 | 0.3 | 0.5 | 0.4 | 0.2 | 0.0 | 0.0 | 0.0 | 0.8 | 0.4 | 0.2 | 0.4 | ||
| 1991 | 0.0 | 0.1 | 0.2 | 1.1 | 1.1 | 0.9 | 0.6 | 0.3 | 0.4 | 0.1 | 0.0 | 0.0 | 0.0 | 0.8 | 0.7 | 0.2 | 0.4 | ||
| 1990 | 0.0 | 0.1 | 0.2 | 0.3 | 0.3 | 0.4 | 0.6 | 0.3 | 0.4 | 0.3 | 0.1 | 0.1 | 0.1 | 0.3 | 0.4 | 0.3 | 0.2 | ||
| 1989 | 0.0 | 0.1 | 0.4 | 0.7 | 0.5 | 0.6 | 0.6 | 0.4 | 0.4 | 0.2 | 0.1 | 0.0 | 0.1 | 0.5 | 0.6 | 0.2 | 0.4 | ||
| 1988 | 0.0 | 0.1 | 0.2 | 0.5 | 0.5 | 0.6 | 0.5 | 0.4 | 0.4 | 0.2 | 0.1 | 0.0 | 0.0 | 0.4 | 0.5 | 0.2 | 0.3 | ||
| 1987 | 0.0 | 0.1 | 0.1 | 0.5 | 0.6 | 0.5 | 0.4 | 0.3 | 0.3 | 0.2 | 0.1 | 0.0 | 0.0 | 0.4 | 0.4 | 0.2 | 0.3 | ||
| 1986 | 0.0 | 0.0 | 0.3 | 1.6 | 1.7 | 1.3 | 1.4 | 1.0 | 0.7 | 0.5 | 0.1 | 0.1 | 0.0 | 1.1 | 1.2 | 0.5 | 0.7 | ||
| 1985 | 0.0 | 0.0 | 0.0 | 0.6 | 0.5 | 224.2 | 0.1 | 0.1 | 0.1 | 0.0 | 0.0 | 0.0 | 0.0 | 0.4 | 158.3 | 0.0 | 33.2 | ||
| 1984 | 0.0 | 0.0 | 0.0 | 0.0 | 0.0 | 0.0 | 0.6 | 0.2 | 0.6 | 0.0 | 0.0 | 0.0 | 0.0 | 0.0 | 0.3 | 0.2 | 0.2 | ||
| 1983 | 0.0 | 0.0 | 0.0 | 0.1 | 0.3 | 0.2 | 0.0 | 0.0 | 0.0 | - | 0.0 | 0.0 | 0.0 | 0.1 | 0.1 | 0.0 | 0.1 | ||
| 1982 | - | 0.0 | - | 0.0 | 0.0 | 0.0 | - | 0.0 | - | 0.0 | - | 0.0 | 0.0 | 0.0 | 0.0 | 0.0 | 0.0 | ||
Reporting rates
Reporting rate is the proportion of all surveys in which the species was present.
Reporting rate by year
This chart shows the reporting rate of Rufous Whistler each year between 1982 and 2017. 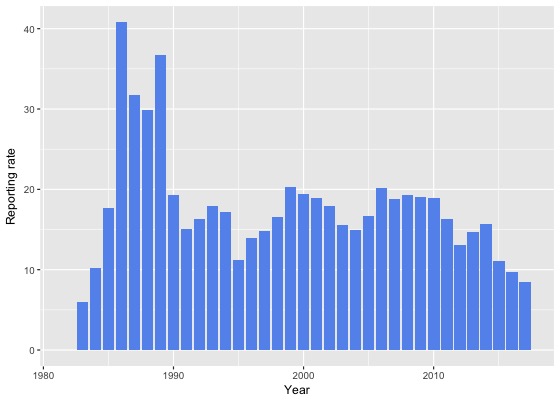
Reporting rate by month
This chart shows the reporting rate by month of Rufous Whistler. The blue lines show the reporting rate for the twelve months to June 2017 and the bars show the average reporting rate for the period 1982 to 2017. 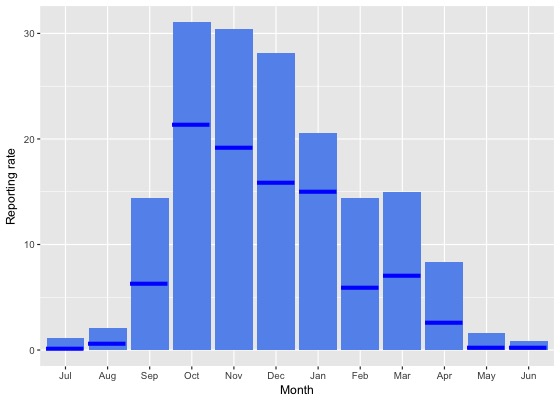
Reporting rate by season
This chart shows the seasonal reporting rate of Rufous Whistler. The blue lines show the seasonal reporting rate for the twelve months to June 2017 and the bars show the average seasonal reporting rate for the period 1982 to 2017. 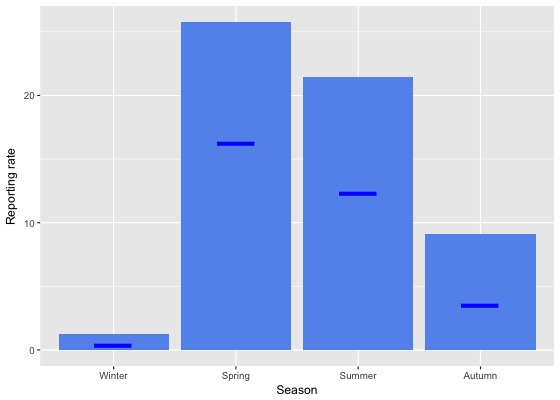
Reporting rate data
| Month | Season | ||||||||||||||||||
|---|---|---|---|---|---|---|---|---|---|---|---|---|---|---|---|---|---|---|---|
| Period | Jul | Aug | Sep | Oct | Nov | Dec | Jan | Feb | Mar | Apr | May | Jun | Winter | Spring | Summer | Autumn | All | ||
| All years | |||||||||||||||||||
| All | 1.1 | 2.0 | 14.4 | 31.0 | 30.4 | 28.1 | 20.5 | 14.4 | 15.0 | 8.3 | 1.6 | 0.8 | 1.3 | 25.7 | 21.5 | 9.1 | 15.5 | ||
| Previous years | |||||||||||||||||||
| All previous years | 1.3 | 2.3 | 15.5 | 32.4 | 32.2 | 30.0 | 21.6 | 16.2 | 16.4 | 9.3 | 1.9 | 1.0 | 1.5 | 27.1 | 23.1 | 10.1 | 16.8 | ||
| Previous 30 years | 1.3 | 2.3 | 15.6 | 32.3 | 31.8 | 30.0 | 21.3 | 16.1 | 16.2 | 9.1 | 1.9 | 0.9 | 1.5 | 27.0 | 23.0 | 10.0 | 16.7 | ||
| Previous 20 years | 0.9 | 1.5 | 15.0 | 30.9 | 27.6 | 27.4 | 18.3 | 13.3 | 13.8 | 7.6 | 0.9 | 0.5 | 0.9 | 25.1 | 20.2 | 8.4 | 15.0 | ||
| 10 year groups | |||||||||||||||||||
| [2007,2017) | 0.7 | 1.5 | 13.3 | 30.5 | 23.7 | 23.7 | 16.1 | 11.5 | 11.7 | 7.2 | 0.7 | 0.4 | 0.8 | 23.9 | 17.3 | 7.4 | 13.8 | ||
| [1997,2007) | 1.2 | 1.5 | 18.4 | 32.1 | 35.3 | 34.5 | 25.7 | 17.9 | 18.1 | 8.4 | 1.5 | 0.7 | 1.1 | 28.0 | 27.5 | 10.9 | 17.8 | ||
| [1987,1997) | 2.7 | 5.0 | 18.6 | 40.5 | 45.8 | 44.3 | 39.2 | 29.3 | 29.9 | 17.1 | 5.6 | 3.2 | 3.7 | 36.1 | 37.9 | 17.9 | 24.5 | ||
| 5 year groups | |||||||||||||||||||
| [2012,2017) | 0.8 | 1.6 | 9.9 | 28.2 | 20.2 | 20.5 | 14.5 | 10.2 | 11.3 | 6.2 | 0.7 | 0.3 | 0.9 | 20.7 | 15.0 | 6.8 | 12.0 | ||
| [2007,2012) | 0.3 | 0.9 | 20.9 | 34.5 | 33.3 | 30.5 | 21.6 | 16.8 | 13.1 | 9.5 | 0.5 | 0.6 | 0.6 | 30.5 | 24.5 | 8.8 | 18.4 | ||
| [2002,2007) | 1.0 | 1.6 | 19.1 | 31.5 | 33.9 | 35.1 | 22.6 | 14.4 | 18.3 | 7.6 | 1.2 | 0.4 | 0.9 | 27.8 | 26.3 | 10.7 | 17.2 | ||
| [1997,2002) | 1.6 | 1.3 | 17.6 | 33.0 | 37.0 | 33.8 | 29.1 | 21.4 | 17.9 | 9.4 | 1.9 | 1.1 | 1.3 | 28.4 | 28.8 | 11.1 | 18.7 | ||
| [1992,1997) | 1.5 | 0.9 | 8.9 | 24.2 | 34.8 | 29.9 | 24.0 | 14.3 | 19.3 | 8.0 | 3.3 | 1.8 | 1.4 | 23.6 | 23.3 | 10.6 | 14.9 | ||
| [1987,1992) | 3.2 | 7.2 | 23.2 | 49.4 | 51.2 | 50.6 | 47.6 | 35.1 | 36.3 | 22.3 | 6.9 | 4.0 | 4.9 | 42.3 | 44.6 | 22.0 | 29.3 | ||
| Year | |||||||||||||||||||
| 2017 | 0.1 | 0.6 | 6.3 | 21.4 | 19.2 | 15.9 | 15.1 | 5.9 | 7.0 | 2.6 | 0.2 | 0.3 | 0.4 | 16.2 | 12.3 | 3.5 | 8.4 | ||
| 2016 | 1.4 | 1.8 | 7.7 | 24.7 | 17.4 | 14.7 | 11.5 | 9.7 | 10.2 | 5.7 | 0.3 | 0.1 | 1.1 | 17.4 | 11.8 | 6.0 | 9.7 | ||
| 2015 | 0.7 | 2.0 | 10.9 | 26.7 | 18.0 | 17.6 | 13.1 | 8.5 | 12.0 | 7.3 | 1.4 | 0.1 | 0.8 | 19.4 | 13.1 | 7.4 | 11.1 | ||
| 2014 | 0.6 | 0.8 | 14.0 | 35.2 | 24.4 | 33.6 | 19.7 | 13.0 | 12.9 | 7.7 | 0.0 | 0.5 | 0.6 | 26.6 | 20.5 | 8.1 | 15.7 | ||
| 2013 | 0.0 | 1.8 | 11.3 | 34.0 | 26.7 | 24.1 | 15.6 | 10.9 | 9.9 | 4.9 | 0.8 | 0.4 | 0.7 | 25.4 | 17.9 | 6.2 | 14.7 | ||
| 2012 | 0.4 | 0.8 | 8.1 | 25.8 | 20.2 | 23.7 | 15.6 | 12.2 | 13.1 | 5.8 | 1.1 | 0.9 | 0.7 | 19.8 | 17.6 | 7.6 | 13.1 | ||
| 2011 | 0.0 | 0.8 | 17.8 | 35.2 | 28.5 | 25.3 | 22.8 | 14.2 | 9.7 | 13.5 | 0.7 | 0.6 | 0.5 | 29.1 | 21.6 | 8.3 | 16.2 | ||
| 2010 | 0.0 | 1.8 | 22.5 | 31.6 | 37.3 | 27.6 | 21.7 | 12.9 | 15.7 | 11.1 | 0.0 | 0.8 | 0.8 | 30.3 | 23.3 | 11.2 | 19.0 | ||
| 2009 | 0.7 | 0.0 | 21.1 | 35.9 | 38.8 | 28.6 | 22.0 | 15.0 | 10.2 | 6.6 | 0.0 | 1.4 | 0.9 | 32.7 | 22.9 | 6.4 | 19.1 | ||
| 2008 | 0.7 | 0.0 | 21.3 | 33.0 | 28.2 | 36.0 | 30.2 | 17.6 | 15.6 | 9.3 | 1.8 | 0.5 | 0.4 | 29.2 | 30.0 | 9.9 | 19.3 | ||
| 2007 | 0.0 | 1.9 | 22.0 | 36.9 | 29.7 | 36.2 | 15.4 | 26.1 | 15.3 | 6.0 | 0.0 | 0.0 | 0.4 | 31.3 | 26.5 | 8.4 | 18.8 | ||
| 2006 | 2.0 | 2.9 | 18.5 | 40.7 | 35.1 | 37.4 | 28.1 | 17.0 | 21.1 | 8.1 | 1.4 | 0.0 | 1.2 | 33.1 | 28.5 | 13.4 | 20.1 | ||
| 2005 | 0.7 | 0.0 | 18.6 | 27.1 | 30.3 | 42.6 | 32.6 | 25.0 | 11.7 | 8.7 | 1.0 | 1.1 | 0.8 | 24.0 | 36.4 | 7.3 | 16.7 | ||
| 2004 | 0.8 | 0.7 | 19.2 | 26.2 | 32.0 | 30.0 | 20.6 | 17.2 | 15.5 | 10.4 | 1.0 | 0.6 | 0.7 | 25.4 | 24.1 | 10.5 | 14.9 | ||
| 2003 | 0.0 | 2.9 | 18.2 | 22.8 | 39.4 | 32.2 | 14.8 | 7.7 | 20.2 | 4.1 | 0.0 | 0.0 | 1.0 | 26.7 | 19.9 | 9.5 | 15.6 | ||
| 2002 | 1.1 | 1.7 | 21.4 | 30.9 | 31.0 | 33.6 | 16.4 | 11.8 | 21.4 | 7.1 | 3.5 | 0.0 | 0.8 | 27.9 | 24.3 | 13.1 | 17.9 | ||
| 2001 | 0.9 | 0.0 | 17.2 | 39.9 | 35.2 | 40.2 | 28.0 | 27.3 | 17.2 | 9.3 | 1.2 | 0.5 | 0.5 | 28.6 | 32.8 | 11.0 | 18.9 | ||
| 2000 | 0.8 | 3.9 | 14.4 | 35.7 | 40.3 | 30.1 | 29.3 | 19.0 | 18.0 | 11.1 | 0.0 | 0.0 | 1.5 | 30.2 | 26.8 | 11.9 | 19.4 | ||
| 1999 | 2.9 | 1.0 | 24.1 | 34.6 | 40.9 | 40.6 | 32.1 | 25.0 | 20.5 | 7.7 | 3.4 | 2.3 | 2.0 | 32.9 | 33.0 | 10.6 | 20.3 | ||
| 1998 | 5.4 | 0.0 | 13.0 | 15.2 | 37.2 | 31.1 | 27.9 | 7.5 | 14.0 | 5.1 | 3.7 | 0.0 | 1.2 | 22.0 | 24.7 | 10.1 | 16.6 | ||
| 1997 | 2.3 | 0.0 | 20.0 | 21.1 | 28.2 | 19.2 | 25.5 | 14.0 | 20.0 | 11.0 | 2.2 | 2.8 | 1.8 | 23.4 | 19.3 | 10.8 | 14.8 | ||
| 1996 | 0.0 | 1.1 | 26.7 | 26.3 | 26.9 | 25.3 | 13.6 | 9.4 | 11.8 | 3.1 | 6.9 | 2.3 | 1.2 | 26.6 | 16.4 | 8.0 | 13.9 | ||
| 1995 | 3.2 | 0.0 | 1.9 | 15.2 | 17.3 | 23.0 | 29.2 | 12.7 | 21.4 | 6.5 | 0.0 | 2.1 | 1.6 | 12.2 | 23.2 | 9.7 | 11.2 | ||
| 1994 | 3.9 | 1.3 | 10.3 | 32.6 | 38.2 | 43.5 | 32.4 | 12.1 | 18.2 | 6.9 | 2.5 | 2.2 | 2.3 | 30.0 | 28.5 | 9.0 | 17.2 | ||
| 1993 | 0.0 | 2.6 | 3.2 | 22.7 | 56.1 | 52.2 | 28.6 | 18.8 | 22.2 | 15.0 | 3.9 | 1.4 | 1.5 | 27.6 | 34.6 | 13.8 | 17.9 | ||
| 1992 | 0.0 | 0.0 | 4.7 | 30.9 | 47.2 | 20.6 | 19.0 | 26.8 | 25.4 | 11.9 | 3.9 | 0.0 | 0.0 | 26.7 | 21.6 | 13.6 | 16.3 | ||
| 1991 | 2.4 | 4.3 | 12.8 | 28.2 | 35.1 | 17.6 | 28.6 | 16.0 | 22.2 | 8.5 | 1.6 | 2.0 | 3.0 | 25.9 | 20.6 | 10.9 | 15.1 | ||
| 1990 | 4.5 | 7.6 | 20.4 | 32.7 | 35.5 | 37.5 | 44.4 | 23.9 | 22.7 | 14.3 | 4.1 | 6.6 | 6.2 | 29.9 | 35.3 | 14.3 | 19.3 | ||
| 1989 | 3.1 | 9.5 | 40.6 | 64.2 | 56.1 | 63.5 | 60.6 | 44.3 | 41.7 | 24.1 | 8.6 | 5.4 | 6.2 | 54.0 | 56.5 | 25.6 | 36.7 | ||
| 1988 | 3.0 | 6.0 | 24.2 | 50.4 | 51.6 | 54.9 | 49.2 | 41.1 | 44.6 | 24.1 | 6.1 | 2.4 | 4.0 | 44.4 | 48.7 | 25.0 | 29.9 | ||
| 1987 | 0.0 | 6.7 | 10.9 | 48.4 | 57.6 | 48.8 | 40.0 | 30.4 | 33.5 | 25.5 | 8.7 | 3.9 | 3.9 | 41.1 | 39.3 | 22.3 | 31.7 | ||
| 1986 | 3.8 | 2.6 | 22.6 | 72.2 | 85.1 | 55.9 | 69.6 | 58.3 | 54.8 | 41.2 | 10.3 | 5.7 | 4.0 | 57.4 | 60.2 | 36.9 | 40.8 | ||
| 1985 | 0.0 | 0.0 | 1.9 | 31.4 | 36.8 | 31.7 | 12.5 | 5.9 | 9.1 | 5.3 | 0.0 | 0.0 | 0.0 | 25.1 | 24.7 | 5.0 | 17.6 | ||
| 1984 | 0.0 | 0.0 | 0.0 | 0.0 | 0.0 | 0.0 | 44.8 | 12.1 | 25.9 | 0.0 | 0.0 | 0.0 | 0.0 | 0.0 | 23.0 | 7.6 | 10.2 | ||
| 1983 | 0.0 | 0.0 | 0.0 | 7.7 | 33.3 | 15.4 | 0.0 | 0.0 | 0.0 | - | 0.0 | 0.0 | 0.0 | 14.8 | 6.7 | 0.0 | 6.0 | ||
| 1982 | - | 0.0 | - | 0.0 | 0.0 | 0.0 | - | 0.0 | - | 0.0 | - | 0.0 | 0.0 | 0.0 | 0.0 | 0.0 | 0.0 | ||
Breeding data
Breeding records by month
Number of breeding records by breeding code and month, 2017 and all years| Breeding code | Jul | Aug | Sep | Oct | Nov | Dec | Jan | Feb | Mar | Apr | May | Jun |
|---|---|---|---|---|---|---|---|---|---|---|---|---|
| 2017 | ||||||||||||
| Breeding (BLA code) | 0 | 0 | 0 | 0 | 0 | 0 | 0 | 0 | 0 | 0 | 0 | 0 |
| Carrying Food | 0 | 0 | 0 | 0 | 0 | 2 | 3 | 0 | 0 | 0 | 0 | 0 |
| Copulating | 0 | 0 | 0 | 0 | 0 | 0 | 0 | 0 | 0 | 0 | 0 | 0 |
| Display | 0 | 0 | 0 | 0 | 0 | 1 | 0 | 0 | 0 | 0 | 0 | 0 |
| Dependent young | 0 | 0 | 0 | 0 | 0 | 3 | 5 | 4 | 2 | 0 | 0 | 0 |
| Faecal sac | 0 | 0 | 0 | 0 | 0 | 0 | 0 | 0 | 0 | 0 | 0 | 0 |
| Inspecting hollow | 0 | 0 | 0 | 0 | 0 | 0 | 0 | 0 | 0 | 0 | 0 | 0 |
| Nest building | 0 | 0 | 0 | 0 | 2 | 0 | 0 | 0 | 0 | 0 | 0 | 0 |
| Nest with eggs | 0 | 0 | 0 | 0 | 0 | 0 | 0 | 0 | 0 | 0 | 0 | 0 |
| Nest with young | 0 | 0 | 0 | 0 | 0 | 0 | 0 | 0 | 0 | 0 | 0 | 0 |
| On/leaving nest | 0 | 0 | 0 | 0 | 0 | 1 | 0 | 0 | 0 | 0 | 0 | 0 |
| All years | ||||||||||||
| Breeding (BLA code) | 0 | 0 | 0 | 2 | 2 | 4 | 3 | 1 | 0 | 0 | 0 | 0 |
| Carrying Food | 0 | 0 | 0 | 4 | 3 | 7 | 12 | 3 | 0 | 0 | 0 | 0 |
| Copulating | 0 | 0 | 0 | 0 | 0 | 0 | 0 | 0 | 0 | 0 | 0 | 0 |
| Display | 0 | 0 | 1 | 12 | 1 | 1 | 0 | 0 | 0 | 0 | 0 | 0 |
| Dependent young | 0 | 0 | 0 | 1 | 5 | 11 | 43 | 36 | 9 | 0 | 0 | 0 |
| Faecal sac | 0 | 0 | 0 | 0 | 0 | 0 | 0 | 0 | 0 | 0 | 0 | 0 |
| Inspecting hollow | 0 | 0 | 0 | 0 | 0 | 0 | 0 | 0 | 0 | 0 | 0 | 0 |
| Nest building | 0 | 0 | 1 | 7 | 19 | 5 | 2 | 1 | 1 | 0 | 0 | 0 |
| Nest with eggs | 0 | 0 | 0 | 0 | 9 | 4 | 2 | 0 | 0 | 0 | 0 | 0 |
| Nest with young | 0 | 0 | 0 | 0 | 9 | 1 | 10 | 0 | 0 | 0 | 0 | 0 |
| On/leaving nest | 0 | 0 | 0 | 4 | 7 | 7 | 3 | 0 | 0 | 0 | 0 | 0 |
Breeding records by year
Average number of breeding records per period by breeding code| Period | Breeding (BLA code) | Carrying Food | Copulating | Display | Dependent young | Faecal sac | Inspecting hollow | Nest building | Nest with eggs | Nest with young | On/leaving nest |
|---|---|---|---|---|---|---|---|---|---|---|---|
| All years | |||||||||||
| All | 0.3 | 0.8 | 0.0 | 0.4 | 2.9 | 0.0 | 0.0 | 1.0 | 0.4 | 0.6 | 0.6 |
| Previous years | |||||||||||
| All previous years | 0.3 | 0.7 | 0.0 | 0.4 | 2.6 | 0.0 | 0.0 | 1.0 | 0.4 | 0.6 | 0.6 |
| Previous 30 years | 0.4 | 0.8 | 0.0 | 0.5 | 2.9 | 0.0 | 0.0 | 1.0 | 0.5 | 0.6 | 0.7 |
| Previous 20 years | 0.6 | 0.8 | 0.0 | 0.7 | 2.2 | 0.0 | 0.0 | 0.8 | 0.1 | 0.1 | 0.9 |
| 10 year groups | |||||||||||
| [2007,2017) | 0.6 | 0.9 | 0.0 | 1.3 | 3.7 | 0.0 | 0.0 | 1.3 | 0.3 | 0.2 | 0.9 |
| [1997,2007) | 0.6 | 0.6 | 0.0 | 0.1 | 0.8 | 0.0 | 0.0 | 0.2 | 0.0 | 0.1 | 1.0 |
| [1987,1997) | 0.0 | 0.8 | 0.0 | 0.0 | 4.2 | 0.0 | 0.0 | 1.4 | 1.2 | 1.6 | 0.1 |
| 5 year groups | |||||||||||
| [2012,2017) | 0.8 | 0.4 | 0.0 | 1.6 | 4.4 | 0.0 | 0.0 | 1.0 | 0.2 | 0.4 | 1.2 |
| [2007,2012) | 0.4 | 1.4 | 0.0 | 1.0 | 3.0 | 0.0 | 0.0 | 1.6 | 0.4 | 0.0 | 0.6 |
| [2002,2007) | 0.2 | 1.2 | 0.0 | 0.2 | 0.8 | 0.0 | 0.0 | 0.2 | 0.0 | 0.2 | 1.6 |
| [1997,2002) | 1.0 | 0.0 | 0.0 | 0.0 | 0.8 | 0.0 | 0.0 | 0.2 | 0.0 | 0.0 | 0.4 |
| [1992,1997) | 0.0 | 0.2 | 0.0 | 0.0 | 1.0 | 0.0 | 0.0 | 0.0 | 0.0 | 0.0 | 0.2 |
| [1987,1992) | 0.0 | 1.4 | 0.0 | 0.0 | 7.4 | 0.0 | 0.0 | 2.8 | 2.4 | 3.2 | 0.0 |
| Year | |||||||||||
| 2017 | 0.0 | 5.0 | 0.0 | 1.0 | 14.0 | 0.0 | 0.0 | 2.0 | 0.0 | 0.0 | 1.0 |
| 2016 | 0.0 | 2.0 | 0.0 | 4.0 | 5.0 | 0.0 | 0.0 | 0.0 | 0.0 | 1.0 | 2.0 |
| 2015 | 0.0 | 0.0 | 0.0 | 1.0 | 4.0 | 0.0 | 0.0 | 0.0 | 1.0 | 0.0 | 2.0 |
| 2014 | 0.0 | 0.0 | 0.0 | 2.0 | 5.0 | 0.0 | 0.0 | 3.0 | 0.0 | 0.0 | 1.0 |
| 2013 | 0.0 | 0.0 | 0.0 | 1.0 | 3.0 | 0.0 | 0.0 | 1.0 | 0.0 | 1.0 | 1.0 |
| 2012 | 4.0 | 0.0 | 0.0 | 0.0 | 5.0 | 0.0 | 0.0 | 1.0 | 0.0 | 0.0 | 0.0 |
| 2011 | 0.0 | 0.0 | 0.0 | 2.0 | 6.0 | 0.0 | 0.0 | 2.0 | 0.0 | 0.0 | 1.0 |
| 2010 | 1.0 | 3.0 | 0.0 | 1.0 | 4.0 | 0.0 | 0.0 | 1.0 | 0.0 | 0.0 | 0.0 |
| 2009 | 0.0 | 0.0 | 0.0 | 1.0 | 2.0 | 0.0 | 0.0 | 1.0 | 1.0 | 0.0 | 1.0 |
| 2008 | 0.0 | 3.0 | 0.0 | 0.0 | 1.0 | 0.0 | 0.0 | 1.0 | 1.0 | 0.0 | 0.0 |
| 2007 | 1.0 | 1.0 | 0.0 | 1.0 | 2.0 | 0.0 | 0.0 | 3.0 | 0.0 | 0.0 | 1.0 |
| 2006 | 0.0 | 2.0 | 0.0 | 1.0 | 1.0 | 0.0 | 0.0 | 0.0 | 0.0 | 0.0 | 4.0 |
| 2005 | 0.0 | 3.0 | 0.0 | 0.0 | 0.0 | 0.0 | 0.0 | 1.0 | 0.0 | 1.0 | 2.0 |
| 2004 | 0.0 | 1.0 | 0.0 | 0.0 | 3.0 | 0.0 | 0.0 | 0.0 | 0.0 | 0.0 | 1.0 |
| 2003 | 1.0 | 0.0 | 0.0 | 0.0 | 0.0 | 0.0 | 0.0 | 0.0 | 0.0 | 0.0 | 1.0 |
| 2002 | 0.0 | 0.0 | 0.0 | 0.0 | 0.0 | 0.0 | 0.0 | 0.0 | 0.0 | 0.0 | 0.0 |
| 2001 | 0.0 | 0.0 | 0.0 | 0.0 | 2.0 | 0.0 | 0.0 | 0.0 | 0.0 | 0.0 | 0.0 |
| 2000 | 2.0 | 0.0 | 0.0 | 0.0 | 0.0 | 0.0 | 0.0 | 1.0 | 0.0 | 0.0 | 0.0 |
| 1999 | 3.0 | 0.0 | 0.0 | 0.0 | 1.0 | 0.0 | 0.0 | 0.0 | 0.0 | 0.0 | 0.0 |
| 1998 | 0.0 | 0.0 | 0.0 | 0.0 | 1.0 | 0.0 | 0.0 | 0.0 | 0.0 | 0.0 | 0.0 |
| 1997 | 0.0 | 0.0 | 0.0 | 0.0 | 0.0 | 0.0 | 0.0 | 0.0 | 0.0 | 0.0 | 2.0 |
| 1996 | 0.0 | 0.0 | 0.0 | 0.0 | 1.0 | 0.0 | 0.0 | 0.0 | 0.0 | 0.0 | 0.0 |
| 1995 | 0.0 | 0.0 | 0.0 | 0.0 | 2.0 | 0.0 | 0.0 | 0.0 | 0.0 | 0.0 | 1.0 |
| 1994 | 0.0 | 0.0 | 0.0 | 0.0 | 0.0 | 0.0 | 0.0 | 0.0 | 0.0 | 0.0 | 0.0 |
| 1993 | 0.0 | 0.0 | 0.0 | 0.0 | 2.0 | 0.0 | 0.0 | 0.0 | 0.0 | 0.0 | 0.0 |
| 1992 | 0.0 | 1.0 | 0.0 | 0.0 | 0.0 | 0.0 | 0.0 | 0.0 | 0.0 | 0.0 | 0.0 |
| 1991 | 0.0 | 0.0 | 0.0 | 0.0 | 1.0 | 0.0 | 0.0 | 2.0 | 0.0 | 0.0 | 0.0 |
| 1990 | 0.0 | 1.0 | 0.0 | 0.0 | 2.0 | 0.0 | 0.0 | 0.0 | 0.0 | 3.0 | 0.0 |
| 1989 | 0.0 | 3.0 | 0.0 | 0.0 | 11.0 | 0.0 | 0.0 | 4.0 | 1.0 | 5.0 | 0.0 |
| 1988 | 0.0 | 1.0 | 0.0 | 0.0 | 9.0 | 0.0 | 0.0 | 2.0 | 9.0 | 6.0 | 0.0 |
| 1987 | 0.0 | 2.0 | 0.0 | 0.0 | 14.0 | 0.0 | 0.0 | 6.0 | 2.0 | 2.0 | 0.0 |
| 1986 | 0.0 | 1.0 | 0.0 | 0.0 | 4.0 | 0.0 | 0.0 | 4.0 | 0.0 | 1.0 | 0.0 |
| 1985 | 0.0 | 0.0 | 0.0 | 0.0 | 0.0 | 0.0 | 0.0 | 1.0 | 0.0 | 0.0 | 0.0 |
| 1984 | 0.0 | 0.0 | 0.0 | 0.0 | 0.0 | 0.0 | 0.0 | 0.0 | 0.0 | 0.0 | 0.0 |
| 1983 | 0.0 | 0.0 | 0.0 | 0.0 | 0.0 | 0.0 | 0.0 | 0.0 | 0.0 | 0.0 | 0.0 |
| 1982 | 0.0 | 0.0 | 0.0 | 0.0 | 0.0 | 0.0 | 0.0 | 0.0 | 0.0 | 0.0 | 0.0 |
Distribution map
Distribution - 2017
This map shows the observed distribution of the Rufous Whistler for 2017.
The red circles are the grid cells where Rufous Whistler have been reported.
The transparency of the red circles indicate how many surveys sheets were submitted for that grid cell; the darker the red the more reliable the data. Of the 315 grid cells with reports, 83 had only one sheet; an example is grid number A11.
The size of the circle represents the reporting rate. The maximum reporting rate for Rufous Whistler was 100.0% (eg grid number A11) and the minimum was 0.1% (eg grid number K15). 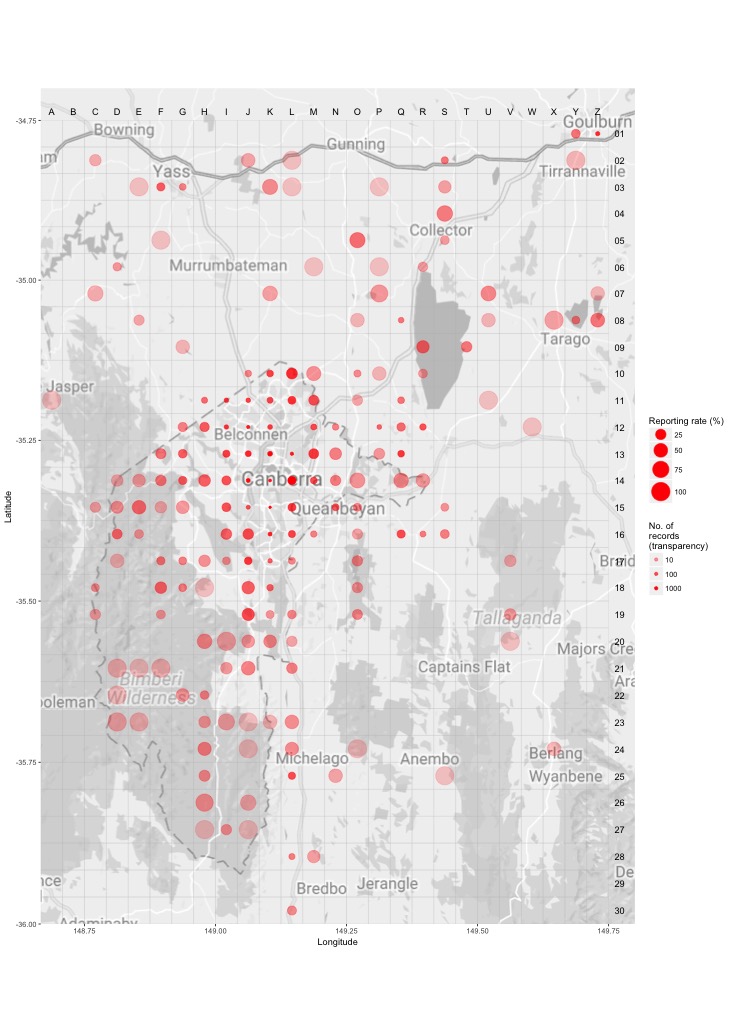
Distribution - all years
This map shows the observed distribution of the Rufous Whistler for all years.
The red circles are the grid cells where Rufous Whistler have been reported.
The transparency of the red circles indicate how many surveys sheets were submitted for that grid cell; the darker the red the more reliable the data. Of the 703 grid cells with reports, 55 had only one sheet; an example is grid number A5.
The size of the circle represents the reporting rate. The maximum reporting rate for Rufous Whistler was 100.0% (eg grid number A5) and the minimum was 0.7% (eg grid number S13). 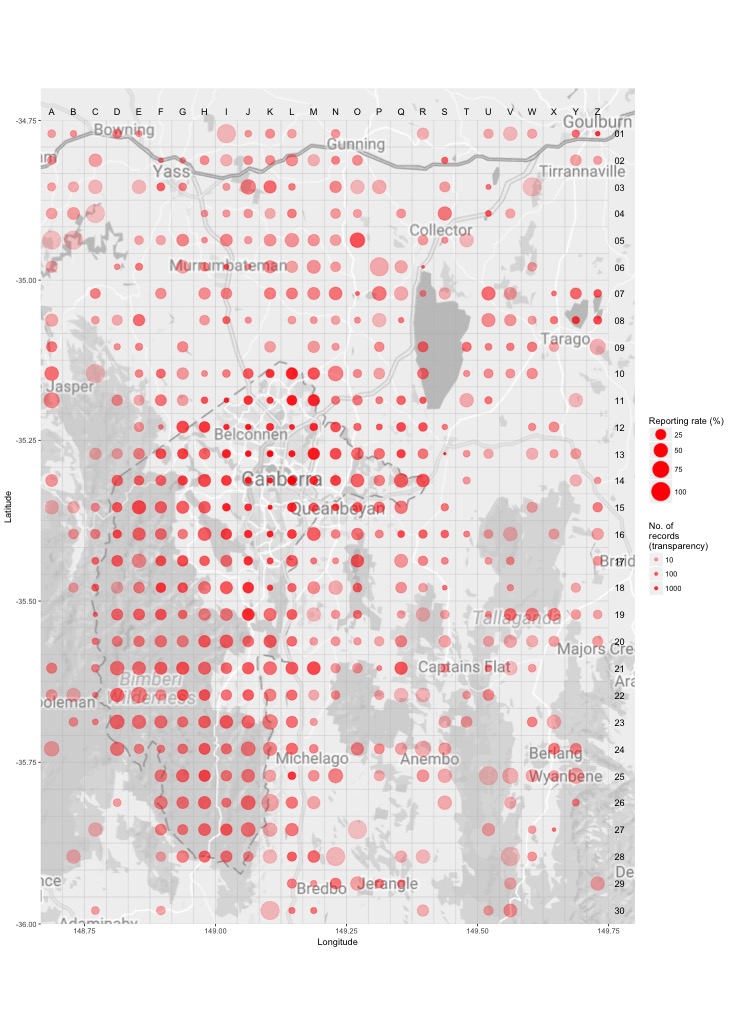
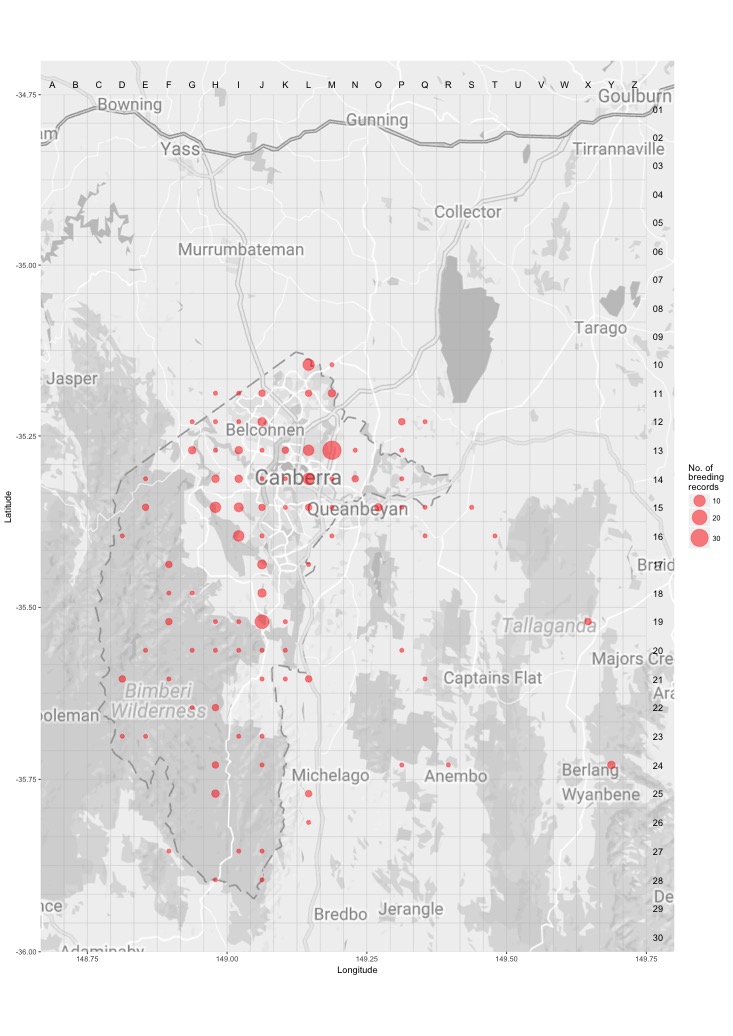
Breeding map
Breeding - 2017
This map shows the breeding distribution of the Rufous Whistler for 2017.
The red circles are the grid cells where breeding activity for Rufous Whistler have been reported.
The size of the circle represents the number of reports. 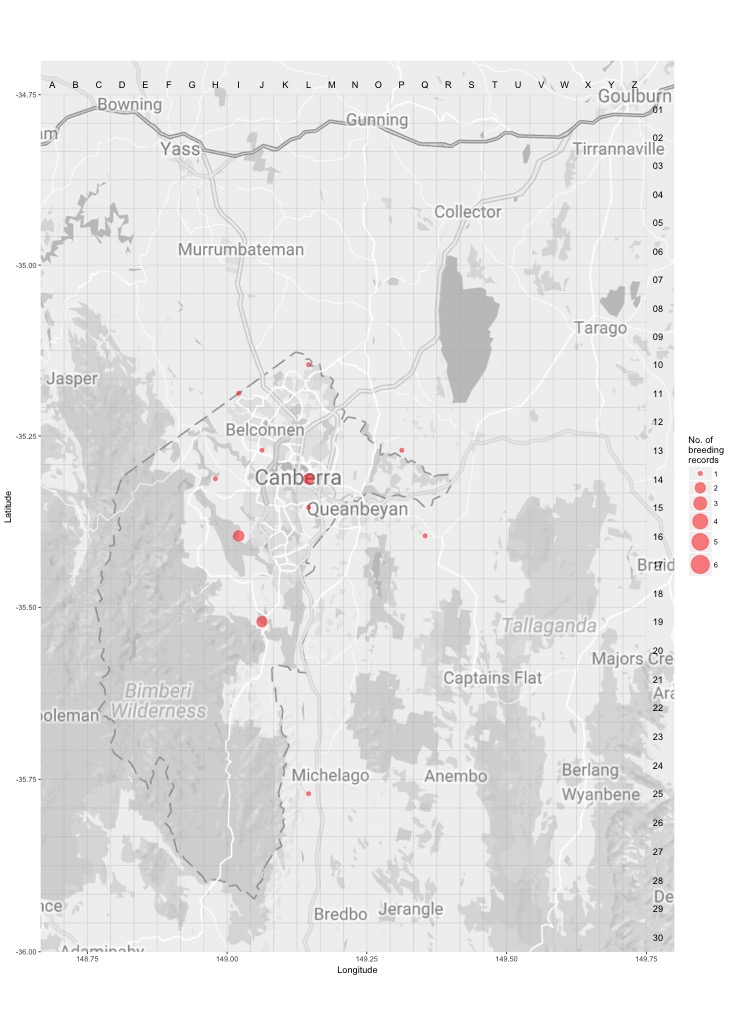
Breeding - all years
This map shows the breeding distribution of the Rufous Whistler for all years.
The red circles are the grid cells where breeding activity for Rufous Whistler have been reported.
The size of the circle represents the number of reports.